


The American Gear Manufacturers Association (AGMA) rating standard, ANSI/AGMA 2101-D04, “Fundamental Rating Factors and Calculation Methods for Involute Spur and Helical Gear Teeth” [1], uses load reversal and reliability factors in the calculation of the rated load capacity for gear teeth. This paper proposes a useful method to calculate the reliability factor instead of using the look-up table in ANSI/AGMA 2101-D04. This paper also explores failure theories that help explain the origin of the AGMA load reversal factor and how it can be more effectively predicted based on material selections.
The reliability factor is used in the rating standard ANSI/AGMA 2101-D04 to account for the effect of the normal statistical distribution of failures found in material testing. In the rating of gears, or in predicting the failure of any mechanical component for that matter, it is vital to understand the nature of the material property data being used in the rating calculations and how that compares to the application being rated. If the material property data, like bending strength, is based on an average value (a 50-percent failure rate or 50-percent reliability), the use of the unmodified material data will overestimate the safety factor if the application is to be rated at 99-percent reliability. Reliability factors are therefore used to adjust for the material property data to match with the application’s reliability expectations.
Reduced levels of statistical failure (higher reliability percentages) will result in a higher reliability factor, which in turn reduces the allowable load-carrying capacity of a material. The normalized reliability level in the AGMA rating standard where the reliability factor is 1.0 is based upon a statistical probability of 1 failure in 100 samples within 107 load cycles. This is equivalent to a 1-percent failure rate, a 99-percent reliability, or 10,000 parts per million (PPM) defective level. Table 1 is reprinted from %%0117-WG-11%% in ANSI/AGMA 2101-D04 and shows a reliability factor that can be used to modify the bending stress number based on using different statistical probabilities in an application. According to the standard, the values used in this table are based upon data developed by the United States Navy for bending and pitting failure.

ANSI/AGMA 2101-D04 only presents this information in table form, which is not efficient when using computerized calculation methods. This paper presents equations that can be used in computerized calculations to establish the reliability factor based on the desired statistical probability of failure. It is hoped that by presenting these equations here, they can be used in future revisions of ANSI/AGMA 2101.
The load reversal factor is discussed in Clause 16.2 of ANSI/AGMA 2101-D04. The standard states that for fully reversing loading conditions on a gear, where the critical point on the fillet sees both a full tensile and nearly equivalent full compressive load in the same rotation cycle, the allowable bending stress number is adjusted to only 70 percent of its value. This is equivalent to a load reversal factor of 0.70 for fully reversing loading conditions. Essentially in gears, this only occurs on idler gears or planet gears. Most gearing applications are in one-way bending only. Therefore, for those situations, the standard says to use the allowable bending stress number without adjustment, or one can say that the load reversal factor is 1.0.
The use of the 0.70 load reversal factor is based on material fatigue failure theory where materials will fail at lower stress levels in fully reversing loading conditions than in one-way bending conditions. What is not discussed in ANSI/AGMA 2101-D04 is how the factor of 70 percent was determined. This paper discusses both the Modified Goodman and Gerber failure theories, which may be more suitable to use than the 70-percent rule in defining fatigue failure.
Reliability Equations
The statistical probability of failure can be defined in an application in several ways. Unfortunately, ANSI/AGMA 2101-D04 uses a rather awkward definition of “fewer than one failure in” some number of gears. Industry more commonly refers to statistical probability of failure in terms of either failure rate (as a percentage), reliability (as a percentage), or PPM defective.
A non-linear regression analysis was performed in order to convert the statistical probabilities from Table 1 into the corresponding reliability factor of Table 1 in equation form.
If the failure rate is specified in terms of one failure in some number of total units, the reliability factor can be estimated as:
![]() Equation 1
Equation 1
where:
KR is reliability factor;
ln is natural log function;
nu is number of units for which one failure will be tolerated.
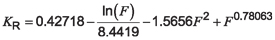
If the failure rate is specified in terms of a decimal percentage (e.g., where 0.10 represents 10 percent failure), the reliability factor can be estimated as:
 Equation 2
where:
F is failure rate as a decimal (e.g., use 0.10 as 10 percent for F).
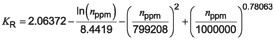
If the failure rate is specified in terms of the PPM defective, the reliability factor can be estimated as:
 Equation 3
where:
nppm is number of units per million total pieces for which failure will be tolerated.
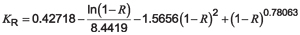
If the failure rate is specified in terms of a decimal reliability percentage (e.g., where 0.90 represents 90 percent reliability), the reliability factor can be estimated as:
 Equation 4
where:
R is reliability as a decimal (e.g., use 0.90 as 90 percent for R).
Equations 1 through 4 all provide identical results for a given statistical probability. The results of these equations are given in Table 2.

Note: Table 2 provides reliability factors for more statistical limits than what is shown in ANSI/AGMA 2101-D04. All values match the ANSI/AGMA 2101-D04 values except for the 100 PPM level where the difference is 1.27 percent.
Load Reversal
Consider a point on the surface of the necked-down section of the rotating shaft mounted on an R.R. Moore rotational beam tester, as shown in Figure 1. The loading arrangement on the shaft has a weight supported by a bearing system that puts a bending load on the shaft. If the load is maximized to the point that the shaft can sustain “infinite life” of at least 107 rotations without failing, then the maximum stress level on the shaft is said to be at its fully reversing bending endurance limit. This load condition is depicted by the black curve in Figure 2.


The stress on a gear tooth on an idler or planet gear can also be considered to be fully reversing in the same way as the rotating shaft of Figure 1. When the gear tooth is loaded on one flank, a point near the fillet of the loaded flank will see a full tensile load. When the idler or planet rotates a partial revolution, the same point sees a fully compressive load of nearly equal magnitude. The only difference is that the stress may not be a sinusoidal-type pattern as much as a load-unload-reverse-load-unload situation (e.g., a saw tooth pattern).
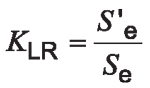
Most gears are not planets or idlers and therefore do not see a fully reversing load condition. Their loading varies from zero to some maximum tensile load similar to the red curve in Figure 2. If we assume that the black curve represents the maximum bending stress that the material can withstand in a fully reversing condition for “infinite life,” then in a similar way, the red curve would represent the maximum bending stress that the material can withstand in a one-way bending condition for “infinite life.” The load reversal factor is a constant that associates the one-way bending to the fully reversing bending stress capacity of the gear material such that:
 Equation 5
where:
KLR is the load reversal factor;
S’e is the fully reversing bending endurance limit at a normalized reliability level, MPa;
Se is the one-way bending endurance limit at a normalized reliability level, MPa.
Note: A normalized reliability level means that both endurance limits must be at the same statistical reliability level from Table 2. The selection of what is considered “normalized” is relevant only in establishing the correct load reversal factor. The load reversal factor itself is presumed to be a constant for all reliability levels. The “normalized” reliability level according to ANSI/AGMA 2101-D04 is one failure in 100 units or 99 percent reliability, but even in that calculation, the designer can select any final reliability level that they choose for a given application. Material property data in that standard is based on a 99-percent reliability.
The question becomes: How does one determine what the load reversal factor is? ANSI/AGMA 2101-D04 only states that a factor of 70 percent (i.e., 0.70) should be used. There is no explanation of what this value is based on. One way to determine this factor would be to actually test gear teeth in both one-way and fully reversing bending conditions to establish the endurance limit for “infinite life.” This could be accomplished using an apparatus similar to that depicted in Figure 3 where, for fully reversing bending, the load would be applied using one vector and then the other in an alternating manner. For one-way bending, the force would only be applied using one of the vectors.


Unfortunately, such testing does not always exist, so we must turn to fatigue failure theory. The fatigue failure of any material can be characterized on an alternating versus mean stress diagram as depicted in Figure 4. While there are several failure theories that may be used to explain this phenomenon, the two most common fatigue failure theories are the Modified Goodman failure theory and the Gerber failure theory.
According to the Modified Goodman failure theory, bending fatigue failure can be predicted by the equation:
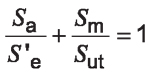 Equation 6
where:
Sa is any value of alternating stress at a normalized reliability level, MPa;
Sm is any value of mean stress at a normalized reliability level, MPa;
Sut is the material ultimate tensile strength at a normalized reliability level, MPa.
Equation 6 is further limited by the intersection of the line:
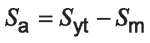 Equation 7
where:
Syt is the material yield strength at a normalized reliability level, MPa.
However, this intersection falls outside of our area of interest, so we can ignore the effect of this modification to the Goodman failure theory.
According to the Gerber failure theory, bending fatigue failure can be predicted by the equation:
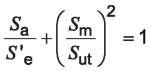 Equation 8
Both failure theories are depicted graphically in Figure 4. Shigley’s Mechanical Engineering Design – 9th Edition [2] considers that the Gerber failure theory more accurately predicts failure under fatigue conditions in gear teeth than the overly conservative Modified Goodman approach.
The abscissa of Figure 4 shows a mean stress value while the ordinate shows the alternating stress. These stress values are also shown graphically in Figure 2 where the alternating stress is the amplitude of the sine wave. For the fully reversing bending condition, the mean stress is 0. Therefore, the fully reversing bending endurance limit, S’e, is the intercept of the ordinate. In one-way bending, the mean stress is always half of the one-way bending endurance limit, Se. Therefore, we can project a line from (0, 0) along a slope where any value of
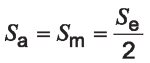 Equation 9
until that line intersects the Modified Goodman or Gerber curves.
These intersection points can then be projected back to the ordinate to determine the one-way bending endurance limit based on either the Modified Goodman or Gerber failure theories. By following this logic, which we describe graphically, we can mathematically predict the load reversal factor for any material based on either the Modified Goodman or Gerber failure theories.
Load reversal factor using Modified Goodman Failure Theory
Consider a point on the surface of the necked-down section of the rotating shaft mounted on an R.R. Moore rotational beam tester shown in Figure 1. The loading arrangement on the shaft has a weight supported by a bearing system that puts a bending load on the shaft. If the load is maximized to the point that the shaft can sustain “infinite life” of at least 107 rotations without failing, then the maximum stress level on the shaft is said to be at its fully reversing bending endurance limit. This load condition is depicted by the black curve in Figure 2.
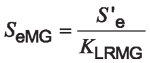
The Modified Goodman failure theory applies to both fully reversing and one-way bending conditions. In the specific case of one-way bending, it is clear that we need to substitute Equation 9 into Equation 6, giving:
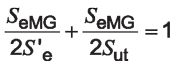 Equation 10
where:
SeMG is one-way bending endurance limit at a normalized reliability level according to Modified Goodman theory, MPa.
This can be further reduced to:
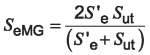 Equation 11
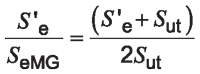 Equation 12
Substituting the load reversal factor from Equation 5:
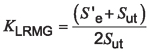 Equation 13
where:
KLRMG is the load reversal factor according to Modified Goodman theory.
If the material’s ultimate tensile strength and fully reversing bending endurance limits are known, the factor can be calculated. Based on these factors, it is evident that the load reversal factor is a material-specific constant. However, caution must be taken to first normalize the material properties to the same statistical reliability before they are applied to Equation 13. Failure to do so will give incorrect results.
The adjustment of the fully reversing bending endurance limit S’e from the material property reliability level to some selected normalized reliability level is:
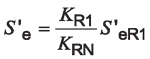 Equation 14
where:
KR1 is the reliability factor at the statistical reliability of the fully reversing bending endurance limit material property data;
KRN is reliability factor at any normalized statistical level;
S’eR1 is the fully reversing bending endurance limit based on the statistical reliability of the material property data, MPa.
The adjustment of the ultimate tensile strength, Sut, from the material property reliability level to some selected normalized reliability level is:
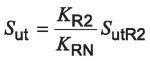 Equation 15
where:
KR2 is the reliability factor at the statistical reliability of the ultimate tensile strength material property data;
SutR2 is the material ultimate tensile strength based on the statistical reliability of the material property data, MPa.
Therefore, Equation 13 can be rewritten for the more generalized case as:
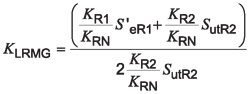 Equation 16
Equation 16 can be simplified to:
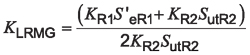 Equation 17
Note: In the final form of Equation 17, the normalized reliability level is factored out of the equation. This means that the resulting load reversal factor is itself independent of the reliability level. Reliability levels are used to ensure that the material property data values match each other. Reliability factors can be easily calculated from the equations in the first part of this paper.
The fully reversing bending endurance limit of a material may be found from testing gears or may be found in publications for gears. However, since this is a material property, the test data does not need to be specific to gears. It can be obtained from publications or by tests of bar material on R.R. Moore machines similar to Figure 1. Such bar testing usually can be accomplished in a few days of run time. At the same time, the ultimate tensile strength of a material is readily available in many publications or can be determined by testing. Care must be taken to ensure that the statistical reliability of any data used in this calculation is known.
The one-way bending endurance limit according to Modified Goodman theory is:
 Equation 18
Note: The result of this equation will be that the one-way bending endurance limit will be at the same reliability level as the fully reversing value used in this equation.
Load reversal factor using Gerber Failure Theory
The Gerber failure theory also applies to both fully reversing and one-way bending conditions. In the specific case of one-way bending, it is clear that we need to substitute Equation 9 into Equation 7, giving:
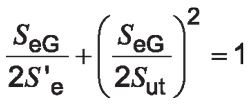 Equation 19
where:
SeG is the one-way bending endurance limit at a normalized reliability level according to Gerber theory, MPa.
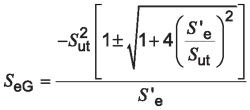
This can be further reduced to the quadratic equation:
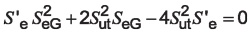 Equation 20
Solving for this quadratic equation:
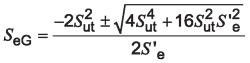 Equation 21
Further reduction yields:
 Equation 22
Dividing both sides by S’e and inverting the expression:
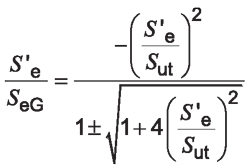 Equation 23
Substituting the load reversal factor from Equation 5:
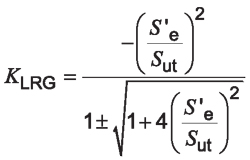 Equation 24
where:
KLRMG is the load reversal factor according to Gerber theory.
The denominator has a ± term to account for both tensile and compressive stress conditions. In our bending failure analysis, we are only concerned with the tensile case, resulting in a positive final value for KLR. Therefore, Equation 24 can be rewritten to only have a positive value result as:
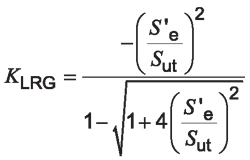 Equation 25
Adjusting for the reliability levels of the material property data as before yields:
 Equation 26
Simplification results in a Gerber-based load reversal factor of:
 Equation 27
The one-way bending endurance limit according to Gerber theory is:
 Equation 28
Note: The result of this equation will be that the one-way bending endurance limit will be at the same reliability level as the fully reversing value used in this equation.
Comparison of Results in Calculating the Load Reversal Factor
The material property data in Table 3 was taken from Jandeska et al. [3] for AISI 8620 quenched and tempered materials and a powder metallurgy (PM) material. Calculation results show that ANSI/AGMA 2101-D04 is consistent with the Modified Goodman failure theory for the AISI 8620 material (transverse direction) listed in Table 3. This does not mean that all materials can be accurately estimated with the 0.70 rule of thumb used in ANSI/AGMA 2101-D04. In fact, for the PM material listed, the strength result according to Modified Goodman would be 4.4 percent stronger than what ANSI/AGMA 930-A05 would suggest (also 0.70).

Using Gerber theory results in a 12.2-percent higher one-way bending endurance limit than the Modified Goodman approach for the AISI 8620 listed (transverse direction). Discussion in the gearing community suggests that the calculation methods of ANSI/AGMA 2101-D04 result in ratings that are 20 to 40 percent more conservative compared to actual results. Use of Gerber theory in calculating the load reversal factor could further narrow this gap.
Conclusion
This paper provided an alternative calculation method for the reliability factors found in ANSI/AGMA 2101-D04 to avoid the use of tables when computerizing the calculation. The equations presented are more accurate than any other published equations found by the author in other literature.
This paper also provided an explanation of the use of Modified Goodman or Gerber failure theories to calculate a load reversal factor, which may be more realistic than that currently proposed by ANSI/AGMA 2101-D04.
References
- ANSI/AGMA 2101-D04 “Fundamental Rating Factors and Calculation Methods for Involute Spur and Helical Gear Teeth,” AGMA, 2004.
- Budynas, Richard G., and Nisbett J. Kieth “Shigley’s Mechanical Engineering Design – 9th Editon,” McGraw-Hill, 2011.
- Jandeska, William, Richard Slattery, et al., “Rolling Contact Fatigue Performance Contrasting Surface Densified, Powder Forged, and Wrought Materials,” PM Tec 2005, Montreal, Canada, June 19–23, 2005.


