


In this succession of papers, we have looked at the history, failure life models, and the impending factors that contribute to bending fatigue. The thesis of this series is that there are many factors to evaluate in terms of individual contribution for diminishing design life in gearing and rotating components. And it must be done with increasing intelligence in order to analytically predict a reasonable, accurate design life. In Part V, we are taking an in-depth historical look at how allowable published metal fatigue values have been empirically determined. Having done so, the technologist will become increasingly more critical in evaluating not only the impending factors, but also the process that was used in determining published allowable values based on standard fatigue samples.
Steel Organizations
There are several organizations that define or reference engineering properties of metals, including MPIF, ASM, SAE, AISI, ASTM, and AME, as well as several more international organizations. There are some critical questions that need to be asked of these organizations, such as which reference material gives us the most accurate, up-to-date mechanical properties, how was that data taken and analyzed, and how much confidence can I put into these design parameters?
Material data from the American Iron and Steel Institute (AISI) is often referenced, but it is an association that deals with the business of making and marketing steel. The American Society for Testing and Materials (ASTM), on the other hand, is a body that defines “standardized” testing so that, supposedly, what one manufacturer calls “304 stainless” is the same material (chemically and physically) as everybody else’s “304 stainless.” However, ASTM is in the business of selling standards. The American Society for Metals (ASM) is an organization of engineers and scientists who work to centralize knowledge of metals with the latest information from the field and disseminate it back to the industry, academia, and government through training and published content. The technologist must vet published data carefully to determine how appropriate it is to the design task at hand. Also, reverse bending data, which is most of the fatigue data published, is more conservative than one-way bending values. And let’s not fail to mention the reliability requirements of your design. These are yet two more impending factors to evaluate. For now, these two are beyond the scope of this paper.
Published Metals Data
Published acceptable metal fatigue values found in classical texts have been experimentally determined by using R.R. Moore fatigue testing machine and samples (Figure 1).

These samples are of standardized geometry and highly polished at the critical diameter to nullify the effects of surface finish. The finish is usually provided to a grit equivalent of 000 emery paper. The weights apply bending force to the critical section. The rotation of the specimen causes the ensuing bending stress to symmetrically alternate between tension and compression with every cycle. There is only one stress level for each specimen. But there are several stress levels evaluated. Stress levels are increased or decreased with the succeeding samples and predicated on the number of cycles to failure of the previous specimen. The goal is to start off with a high stress, and then increment downward with a reduced, but constant, increment level for successive samples. However, long failure times are an indication that the stress is too low, so it is reasonable to have a good idea of where to start and to have a sensible, but constant, increment level in order to make the testing practical to perform. In a sense, the R.R. Moore test results in a pure material endurance limit value. Once the test results are taken, there is a specific method of analyzing the data (Figure 2).

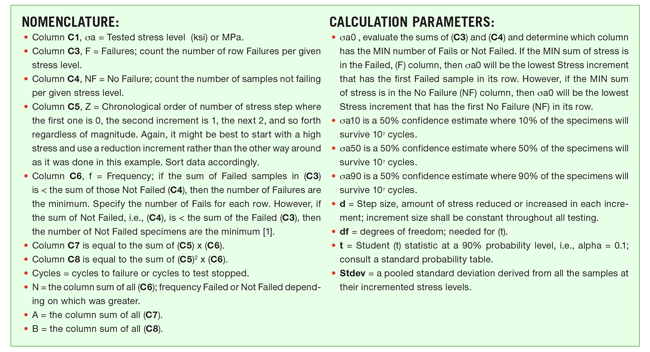 The calculations that follow are made with historical data of wrought AISI 4340 HT with a Rockwell hardness of (40 Rc), which is a popular through hardened gear material. The analysis of test sample data will be made with the staircase method for fatigue strength testing to determine the mean endurance limit of the material [1].
Particular attention should be made to this unique analysis process and how the test method itself can generate either acceptable or unacceptable endurance limit values. The following notes should be mentioned:
- The staircase method will estimate the standard deviation and stresses for 10 percent, 50 percent, and 90 percent survival for the test bars
- Rotational speed of the samples can be up to and in excess of 10,000 rpm. This speed is recommended so that 107 cycles can be accomplished in approximately 16.7 hours. For many steels, 107 cycles represent the point of infinite fatigue life. This may not be true in every case, but in general, it has proven to be a reasonable assumption. High speed hysteresis is an issue that must be addressed. It is assumed that the quality of testing will nullify its impact.
- An automatic switch exists to turn the test off when samples break, and a cycle counter is integral to the test equipment.
- A minimum of 25 samples is recommended for a calculation of the endurance limit. More samples for replicates are highly recommended for greater statistical confidence.
Conclusions
When doing the math, it is clear that the load step increment matters. Also, note that the step increment cannot be changed once selected. Selecting too fine a step generates subsequent testing that requires an unreasonable amount of time. Too large a step and all the testing and variation will calculate a coarsely pooled standard deviation. If there is curvature, a coarse increment may miss this tendency. In this statistical analysis, the standard deviation is the most critical parameter for determining the endurance limit of the material. This is essentially the crux of the process — using a very low quantity of highly controlled test samples at varying load levels to determine a useful standard deviation for the calculation of metal endurance life. In addition, the assumption is that the test bar outcome will be so definitive that the final result is statistical with high confidence. After examining a significant amount of data, it is my opinion that the staircase method can be a good indicator of metal fatigue life. Based on other historical tests using the staircase method, this process was evaluated carefully with many samples and found to be reasonably accurate. However, what becomes clear is that the number of samples, geometry control, step size, and where the test begins and ends are critical.
Therefore, the confidence we can put into published data is proportional to the discipline and control of the process and the empirical choices made in the testing. And this is just the beginning. A multitude of impending, derating factors must be applied to this empirical material limit in gearing or machine design depending on the specific material parameters and application. This process is vastly different and more sensitive to variation than testing a quantity of samples at one stress level, generating a standard deviation, and correlating the result to a population parameter.
What happens to the result when replicate samples have wide variation? The pooled standard deviation and confidence limit bands get larger. More samples may be needed for the mean result to diverge toward a true population parameter. What happens when sample runs are terminated before failure? Shortcuts are tempting especially for long cycle periods. For metals, it is best to never stop before failure, except for those samples that run in excess of 107 cycles.
Standard deviation estimation can be difficult using staircase testing because of the very nature of the testing itself. By concentrating the majority of the data points near the mean, it is more difficult to get an accurate measure of dispersion, which is exactly what standard deviation represents. However, this limitation can be overcome by using a large number of specimens for each stress step.
But using a very large number of specimens would defeat the purpose of doing staircase testing to realize gains in efficiency versus balanced test strategies like the probit method.
The Air Force document by Randall D. Pollak [3] outlines how a modified Dixon-Mood analysis can be used for tests using very few samples. This author’s research into the validity of staircase method techniques may be the most authoritative dissertation on this subject. Any technologist contemplating R.R. Moore type testing for material fatigue values should master the information in Pollak’s outstanding work.
In the next and last part of this series, we are going to explore another way for determining the design life of actual components or specific geometry by the use and utility of the Weibull distribution model in the analysis of survival data.
References
“Process Specification for Type 46XX Powder-Forged Weapon Components Final Technical Report 1985,” Steven Buzolits, Contractor Report ARSCD-CR-85005, AD-E401375, August 1985.
“Standard Test Methods for Metal Powders and Powder Metallurgy Products Metal Powder Industry,” Federation Standard Test Methods – Standard 56.
“Analysis of Methods for Determining High Cycle Fatigue Strength of a Material with Investigation of Ti-6al-4v Gigacyclefatigue Behavior,” Dissertation by Randall D. Pollak, Major, USAF, AFIT/DS/ENY/06-07, October 2005.


